Section 4
CP/M Dynamic Debugging Tool


Table of Contents

4.1 Introduction
4.2 DDT Commands

4.2.1 The A (Assembly) Command
4.2.2 The D (Display) Command
4.2.3 The F (Fill) Command
4.2.4 The G (Go) Command
4.2.5 The I (Input) Command
4.2.6 The L (List) Command
4.2.7 The M (Move) Command
4.2.8 The R (Read) Command
4.2.9 The S (Set) Command
4.2.10 The T (Trace) Command
4.2.11 The U (Untrace) Command
4.2.12 The X (Examine) Command

4.3 Implementation Notes
4.4 A Sample Program

Tables

4-1 Line-editing Controls
4-2 DDT Commands
4-3 CPU Registers


4.1 Introduction

The DDT program allows dynamic interactive testing and debugging of programs generated in the CP/M environment. Invoke the debugger with a command of one of the following forms:

     DDT
     DDT filename.HEX
     DDT filename.COM

where filename is the name of the program to be loaded and tested. In both cases, the DDT program is brought into main memory in place of the Console Command Processor (CCP) and resides directly below the Basic Disk Operating System (BDOS) portion of CP/M. Refer to Section 5 for standard memory organization. The BDOS starting address, located in the address field of the JMP instruction at location 5H, is altered to reflect the reduced Transient Program Area (TPA) size.

The second and third forms of the DDT command perform the same actions as the first, except there is a subsequent automatic load of the specified HEX or COM file. The action is identical to the following sequence of commands:

     DDT
     Ifilename.HEX or Ifilename.COM
     R

where the I and R commands set up and read the specified program to test. See the explanation of the I and R commands below for exact details.

Upon initiation, DDT prints a sign-on message in the form:

     DDT VER m.m

where m.m is the revision number.

Following the sign-on message, DDT prompts you with the hyphen character, -, and waits for input commands from the console. You can type any of several singlecharacter commands, followed by a carriage return to execute the command. Each line of input can be line-edited using the following standard CP/M controls:

Table 4-1. Line-editing Controls
ControlResult
ruboutremoves the last character typed
CTRL-Uremoves the entire line, ready for retyping
CTRL-Creboots system

Any command can be up to 32 characters in length. An automatic carriage return is inserted as character 33, where the first character determines the command type. Table 4-2 describes DDT commands.

Table 4-2. DDT Commands
Command
Character
Result
Aenters assembly-language mnemonics with operands.
Ddisplays memory in hexadecimal and ASCII.
Ffills memory with constant data.
Gbegins execution with optional breakpoints.
Isets up a standard input File Control Block.
Llists memory using assembler mnemonics.
Mmoves a memory segment from source to destination.
Rreads a program for subsequent testing.
Ssubstitutes memory values.
Ttraces program execution.
Uuntraced program monitoring.
Xexamines and optionally alters the CPU state.

The command character, in some cases, is followed by zero, one, two, or three hexadecimal values, which are separated by commas or single blank characters. All DDT numeric output is in hexadecimal form. The commands are not executed until the carriage return is typed at the end of the command.

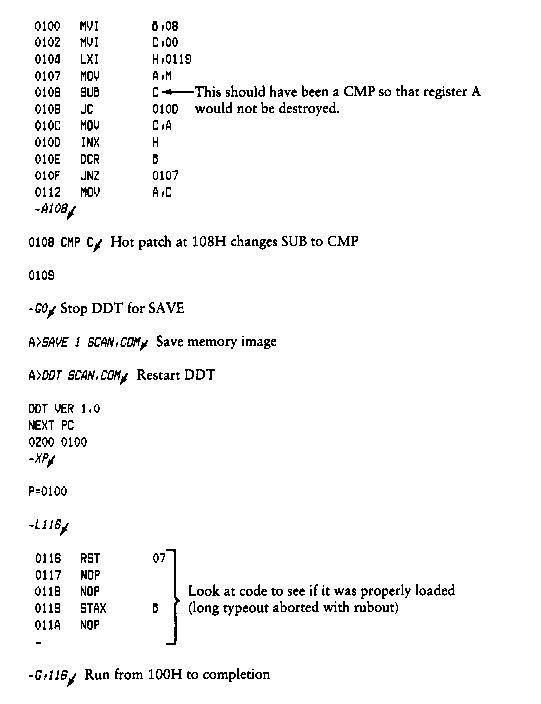
At any point in the debug run, you can stop execution of DDT by using either a CTRL-C or G0 (jump to location 0000H) and save the current memory image by using a SAVE command of the form:

     SAVE n filename.COM

where n is the number of pages (256 byte blocks) to be saved on disk. The number of blocks is determined by taking the high-order byte of the address in the TPA and converting this number to decimal. For example, if the highest address in the TPA is 134H, the number of pages is 12H or 18 in decimal. You could type a CTRL-C during the debug run, returning to the CCP level, followed by

     SAVE 18 X.COM

The memory image is saved as X.COM on the disk and can be directly executed by typing the name X. If further testing is required, the memory image can be recalled by typing

     DDT X.COM

which reloads the previously saved program from location 100H through page 18, 23FFH. The CPU state is not a part of the COM file; thus, the program must be restarted from the beginning to test it properly.

4.2 DDT Commands

The individual commands are detailed below. In each case, the operator must wait for the hyphen prompt character before entering the command. If control is passed to a program under test, and the program has not reached a breakpoint, control can be returned to DDT by executing a RST 7 from the front panel. In the explanation of each command, the command letter is shown in some cases with numbers separated by commas, the numbers are represented by lower-case letters. These numbers are always assumed to be in a hexadecimal radix and from one to four digits in length. Longer numbers are automatically truncated on the right.

Many of the commands operate upon a CPU state that corresponds to the program under test. The CPU state holds the registers of the program being debugged and initially contains zeros for all registers and flags except for the program counter, P, and stack pointer, S, which default to 100H. The program counter is subsequently set to the starting address given in the last record of a HEX file if a file of this form is loaded, see the I and R commands.

4.2.1 The A (Assembly) Command

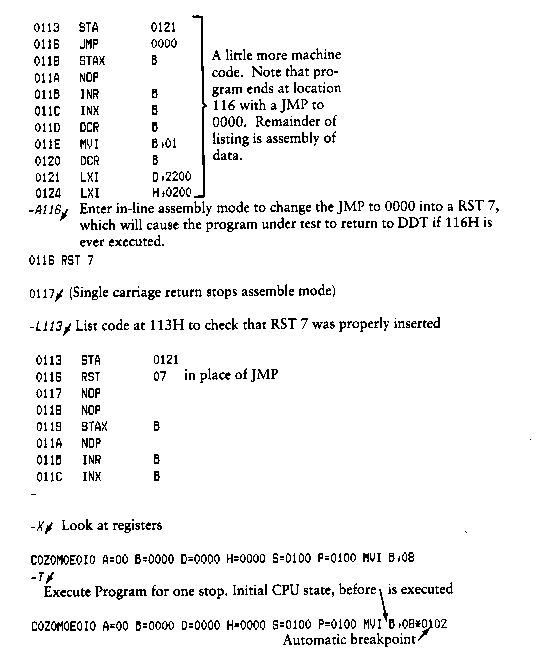
DDT allows in-line assembly language to be inserted into the current memory image using the A command, which takes the form:

     As

where s is the hexadecimal starting address for the in-line assembly. DDT prompts the console with the address of the next instruction to fill and reads the console, looking for assembly- language mnemonics followed by register references and operands in absolute hexadecimal form. See the Intel 8080 Assembly Language Reference Card for a list of mnemonics. Each successive load address is printed before reading the console. The A command terminates when the first empty line is input from the console.

Upon completion of assembly language input, you can review the memory segment using the DDT disassembler (see the L command).

Note that the assembler/disassembler portion of DDT can be overlaid by the transient program being tested, in which case the DDT program responds with an error condition when the A and L commands are used.

4.2.2 The D (Display) Command

The D command allows you to view the contents of memory in hexadecimal and ASCII formats. The D command takes the forms:

     D
     Ds
     Ds,f

In the first form, memory is displayed from the current display address, initially 100H, and continues for 16 display lines. Each display line takes the followng form:

     aaaa bb bb bb bb bb bb bb bb bb bb bb bb bb bb bb bb cccccccccccccccc

where aaaa is the display address in hexadecimal and bb represents data present in memory starting at aaaa. The ASCII characters starting at aaaa are to the right (represented by the sequence of character c) where nongraphic characters are printed as a period. You should note that both upper- and lower-case alphabetics are displayed, and will appear as upper-case symbols on a console device that supports only upper-case. Each display line gives the values of 16 bytes of data, with the first line truncated so that the next line begins at an address that is a multiple of 16.

The second form of the D command is similar to the first, except that the display address is first set to address s.

The third form causes the display to continue from address s through address f. In all cases, the display address is set to the first address not displayed in this command, so that a continuing display can be accomplished by issuing successive D commands with no explicit addresses.

Excessively long displays can be aborted by pressing the return key.

4.2.3 The F (Fill) Command

The F command takes the form:

     Fs,f,c

where s is the starting address, f is the final address, and c is a hexadecimal byte constant. DDT stores the constant c at address s, increments the value of s and test against f. If s exceeds f, the operation terminates, otherwise the operation is repeated. Thus, the fill command can be used to set a memory block to a specific constant value.

4.2.4 The G (Go) Command

A program is executed using the G command, with up to two optional breakpoint addresses. The G command takes the forms:

     G
     Gs
     Gs,b
     Gs,b,c
     G,b
     G,b,c

The first form executes the program at the current value of the program counter in the current machine state, with no breakpoints set. The only way to regain control in DDT is through a RST 7 execution. The current program counter can be viewed by typing an X or XP command.

The second form is similar to the first, except that the program counter in the current machine state is set to address s before execution begins.

The third form is the same as the second, except that program execution stops when address b is encountered (b must be in the area of the program under test). The instruction at location b is not executed when the breakpoint is encountered.

The fourth form is identical to the third, except that two breakpoints are specified, one at b and the other at c. Encountering either breakpoint causes execution to stop and both breakpoints are cleared. The last two forms take the program counter from the current machine state and set one and two breakpoints, respectively.

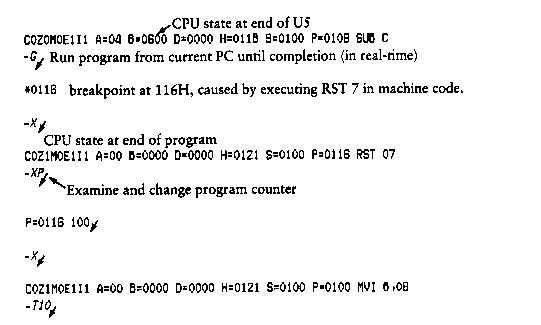
Execution continues from the starting address in real-time to the next breakpoint. There is no intervention between the starting address and the break address by DDT. If the program under test does not reach a breakpoint, control cannot return to DDT without executing a RST 7 instruction. Upon encountering a breakpoint, DDT stops execution and types

     *d

where d is the stop address. The machine state can be examined at this point using the X (Examine) command. You must specify breakpoints that differ from the program counter address at the beginning of the G command. Thus, if the current program counter is 1234H, then the following commands:

     G,1234
     G400,400

both produce an immediate breakpoint without executing any instructions.

4.2.5 The I (Input) Command

The I command allows you to insert a filename into the default File Control Block (FCB) at 5CH. The FCB created by CP/M for transient programs is placed at this location (see Section 5). The default FCB can be used by the program under test as if it had been passed by the CP/M Console Processor. Note that this filename is also used by DDT for reading additional HEX and COM files. The I command takes the forms:

     Ifilename
     Ifilename.typ

If the second form is used and the filetype is either HEX or COM, subsequent R commands can be used to read the pure binary or hex format machine code. Section 4.2.8 gives further details.

4.2.6 The L (List) Command

The L command is used to list assembly-language mnemonics in a particular program region. The L command takes the forms:

     L
     Ls
     Ls,f

The first form lists twelve lines of disassembled machine code from the current list address. The second form sets the list address to s and then lists twelve lines of code. The last form lists disassembled code from s through address f. In all three cases, the list address is set to the next unlisted location in preparation for a subsequent L command. Upon encountering an execution breakpoint, the list address is set to the current value of the program counter (G and T commands). Again, long typeouts can be aborted by pressing RETURN during the list process.

4.2.7 The M (Move) Command

The M command allows block movement of program or data areas from one location to another in memory. The M command takes the form:

     Ms,f,d

where s is the start address of the move, f is the final address, and d is the destination address. Data is first removed from s to d, and both addresses are incremented. If s exceeds f, the move operation stops; otherwise, the move operation is repeated.

4.2.8 The R (Read) Command

The R command is used in conjunction with the I command to read COM and HEX files from the disk into the transient program area in preparation for the debug run. The R command takes the forms:

     R
     Rb

where b is an optional bias address that is added to each program or data address as It is loaded. The load operation must not overwrite any of the system parameters from 000H through 0FFH (that is, the first page of memory). If b is omitted, then b = 0000 is assumed. The R command requires a previous I command, specifying the name of a HEX or COM file. The load address for each record is obtained from each individual HEX record, while an assumed load address of 100H is used for COM files. Note that any number of R commands can be issued following the I command to reread the program under test, assuming the tested program does not destroy the default area at 5CH. Any file specified with the filetype COM is assumed to contain machine code in pure binary form (created with the LOAD or SAVE command), and all others are assumed to contain machine code in Intel hex format (produced, for example, with the ASM command).

Recall that the command,

     DDT filename.typ

which initiates the DDT program, equals to the following commands:

     DDT
     - Ifilename.typ
     - R

Whenever the R command is issued, DDT responds with either the error indicator ? (file cannot be opened, or a checksum error occurred in a HEX file) or with a load message. The load message takes the form:

     NEXT PC
     nnnn pppp

where nnnn is the next address following the loaded program and pppp is the assumed program counter (100H for COM files, or taken from the last record if a HEX file is specified).

4.2.9 The S (Set) Command

The S command allows memory locations to be examined and optionally altered. The S command takes the form:

     Ss

where s is the hexadecimal starting address for examination and alteration of memory. DDT responds with a numeric prompt, giving the memory location, along with the data currently held in memory. If you type a carriage return, the data is not altered. If a byte value is typed, the value is stored at the prompted address. In either case, DDT continues to prompt with successive addresses and values until you type either a period or an invalid input value is detected.

4.2.10 The T (Trace) Command

The T command allows selective tracing of program execution for 1 to 65535 program steps. The T command takes the forms:

     T
     Tn

In the first form, the CPU state is displayed and the next program step is executed. The program terminates immediately, with the termination address displayed as

     *hhhh

where hhhh is the next address to execute. The display address (used in the D command) is set to the value of H and L, and the list address (used in the L command) is set to hhhh. The CPU state at program termination can then be examined using the X command.

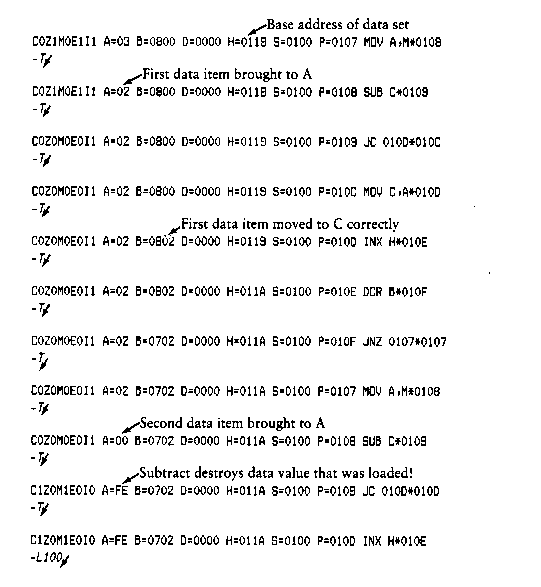
The second form of the T command is similar to the first, except that execution is traced for n steps (n is a hexadecimal value) before a program breakpoint occurs. A breakpoint can be forced in the trace mode by typing a rubout character. The CPU state is displayed before each program step is taken in trace mode. The format of the display is the same as described in the X command.

You should note that program tracing is discontinued at the CP/M interface and resumes after return from CP/M to the program under test. Thus, CP/M functions that access I/O devices, such as the disk drive, run in real-time, avoiding I/O timing problems. Programs running in trace mode execute approximately 500 times slower than real-time because DDT gets control after each user instruction is executed. Interrupt processing routines can be traced, but commands that use the breakpoint facility (G, T, and U) accomplish the break using an RST 7 instruction, which means that the tested program cannot use this interrupt location. Further, the trace mode always runs the tested program with interrupts enabled, which may cause problems if asynchronous interrupts are received during tracing.

To get control back to DDT during trace, press RETURN rather than executing an RST 7. This ensures that the trace for current instruction is completed before interruption.

4.2.11 The U (Untrace) Command
The U command is identical to the T command, except that intermediate program steps are not displayed. The untrace mode allows from 1 to 65535 (0FFFFH) steps to be executed in monitored mode and is used principally to retain control of an executing program while it reaches steady state conditions. All conditions of the T command apply to the U command.

4.2.12 The X (Examine) Command

The X command allows selective display and alteration of the current CPU state for the program under test. The X command takes the forms:

     X
     Xr

where r is one of the 8080 CPU registers listed in the following table.

Table 4-3. CPU Registers
RegisterMeaningValue
CCarry flag(0/1)
ZZero flag(0/1)
MMinus flag(0/1)
EEven parity flag(0/1)
Ilnterdigit carry(0/1)
AAccumulator(0-FF)
BBC register pair(0-FFFF)
DDE register pair(0-FFFF)
HHL register pair(0-FFFF)
SStack pointer(0-FFFF)
PProgram counter(0-FFFF)

In the first case, the CPU register state is displayed in the format:

     CfZfMfEflf A=bb B=dddd D=dddd H=dddd S=dddd P=dddd inst

where f is a 0 or 1 flag value, bb is a byte value, and dddd is a double-byte quantity corresponding to the register pair. The inst field contains the disassembled instruction, that occurs at the location addressed by the CPU state's program counter.

The second form allows display and optional alteration of register values, where r is one of the registers given above (C, Z, M, E, I, A, B, D, H, S, or P). In each case, the flag or register value is first displayed at the console. The DDT program then accepts input from the console. If a carriage return is typed, the flag or register value is not altered. If a value in the proper range is typed, the flag or register value is altered. You should note that BC, DE, and HL are displayed as register pairs. Thus, you must type the entire register pair when B, C, or the BC pair is altered.

4.3 Implementation Notes

The organization of DDT allows certain nonessential portions to be overlaid to gain a larger transient program area for debugging large programs. The DDT program consists of two parts: the DDT nucleus and the assembler/disassembler module. The DDT nucleus is loaded over the CCP and, although loaded with the DDT nucleus, the assembler/disassembler is overlayable unless used to assemble or disassemble.

In particular, the BDOS address at location 6H (address field of the JMP instruction at location 5H) is modified by DDT to address the base location of the DDT nucleus, which, in turn, contains a JMP instruction to the BDOS. Thus, programs that use this address field to size memory see the logical end of memory at the base of the DDT nucleus rather than the base of the BDOS.

The assembler/disassembler module resides directly below the DDT nucleus in the transient program area. If the A, L, T, or X commands are used during the debugging process, the DDT program again alters the address field at 6H to include this module, further reducing the logical end of memory. If a program loads beyond the beginning of the assembler/disassembler module, the A and L commands are lost (their use produces a ? in response) and the trace and display (T and X) commands list the inst field of the display in hexadecimal, rather than as a decoded instruction.

4.4 A Sample Program

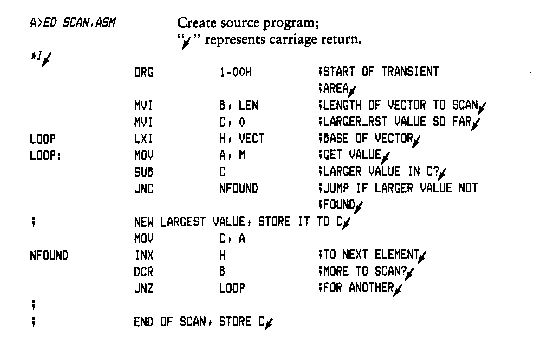
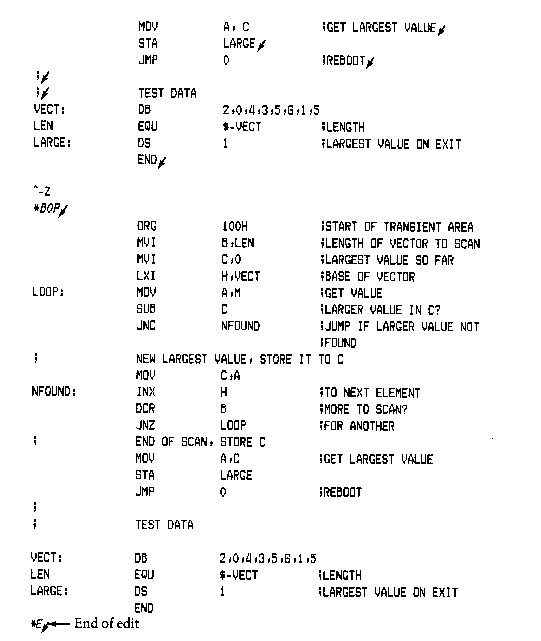
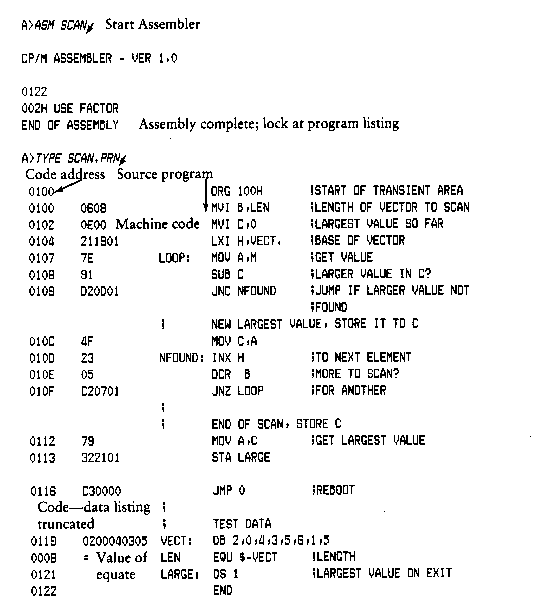
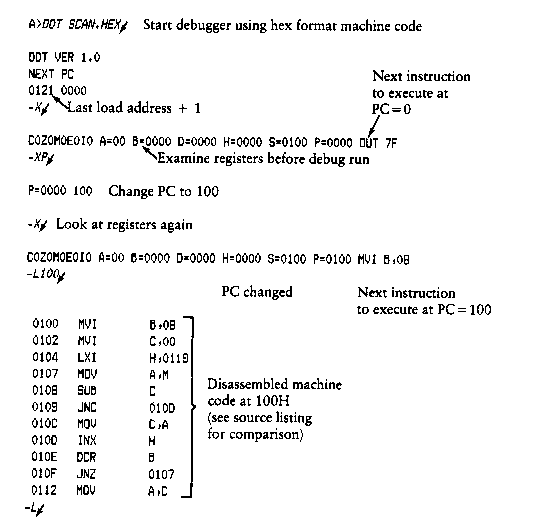
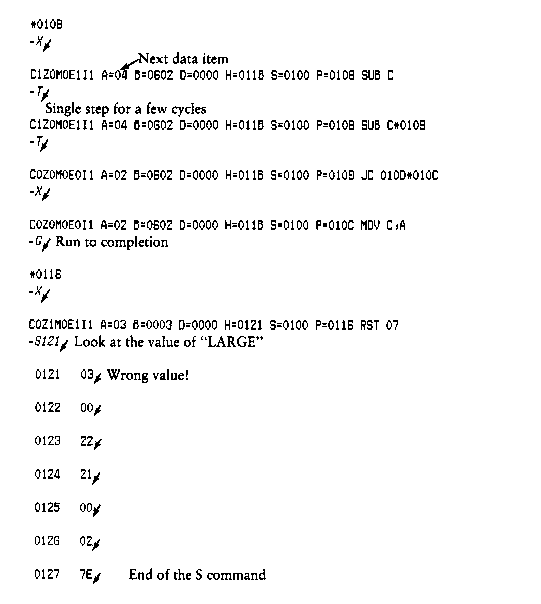
The following example shows an edit, assemble, and debug for a simple program that reads a set of data values and determines the largest value in the set. The largest value is taken from the vector and stored into LARGE at the termination of the program.


Back to title page       Next